Dual-Loop Control
Independent PID loops for pressure (PSM) and temperature (MCPWM) to ensure consistent extraction.
A dual closed-loop control system for espresso machines: Pressure loop (PID + Phase-Skip Modulation) and Temperature loop (PID + MCPWM), paired with an OLED menu and real-time sensor smoothing.
Espresso Controller stabilizes brew pressure and water temperature using two independent PID loops. The system reads a 0.5–4.5V pressure transducer via ADC averaging and a MAX6675 thermocouple for temperature, then modulates power through PSM (phase-skip with zero-cross detection) and MCPWM (heater duty control).
Independent PID loops for pressure (PSM) and temperature (MCPWM) to ensure consistent extraction.
ADC-averaged pressure readings with MPa/psi conversion; MAX6675 thermocouple for boiler temp.
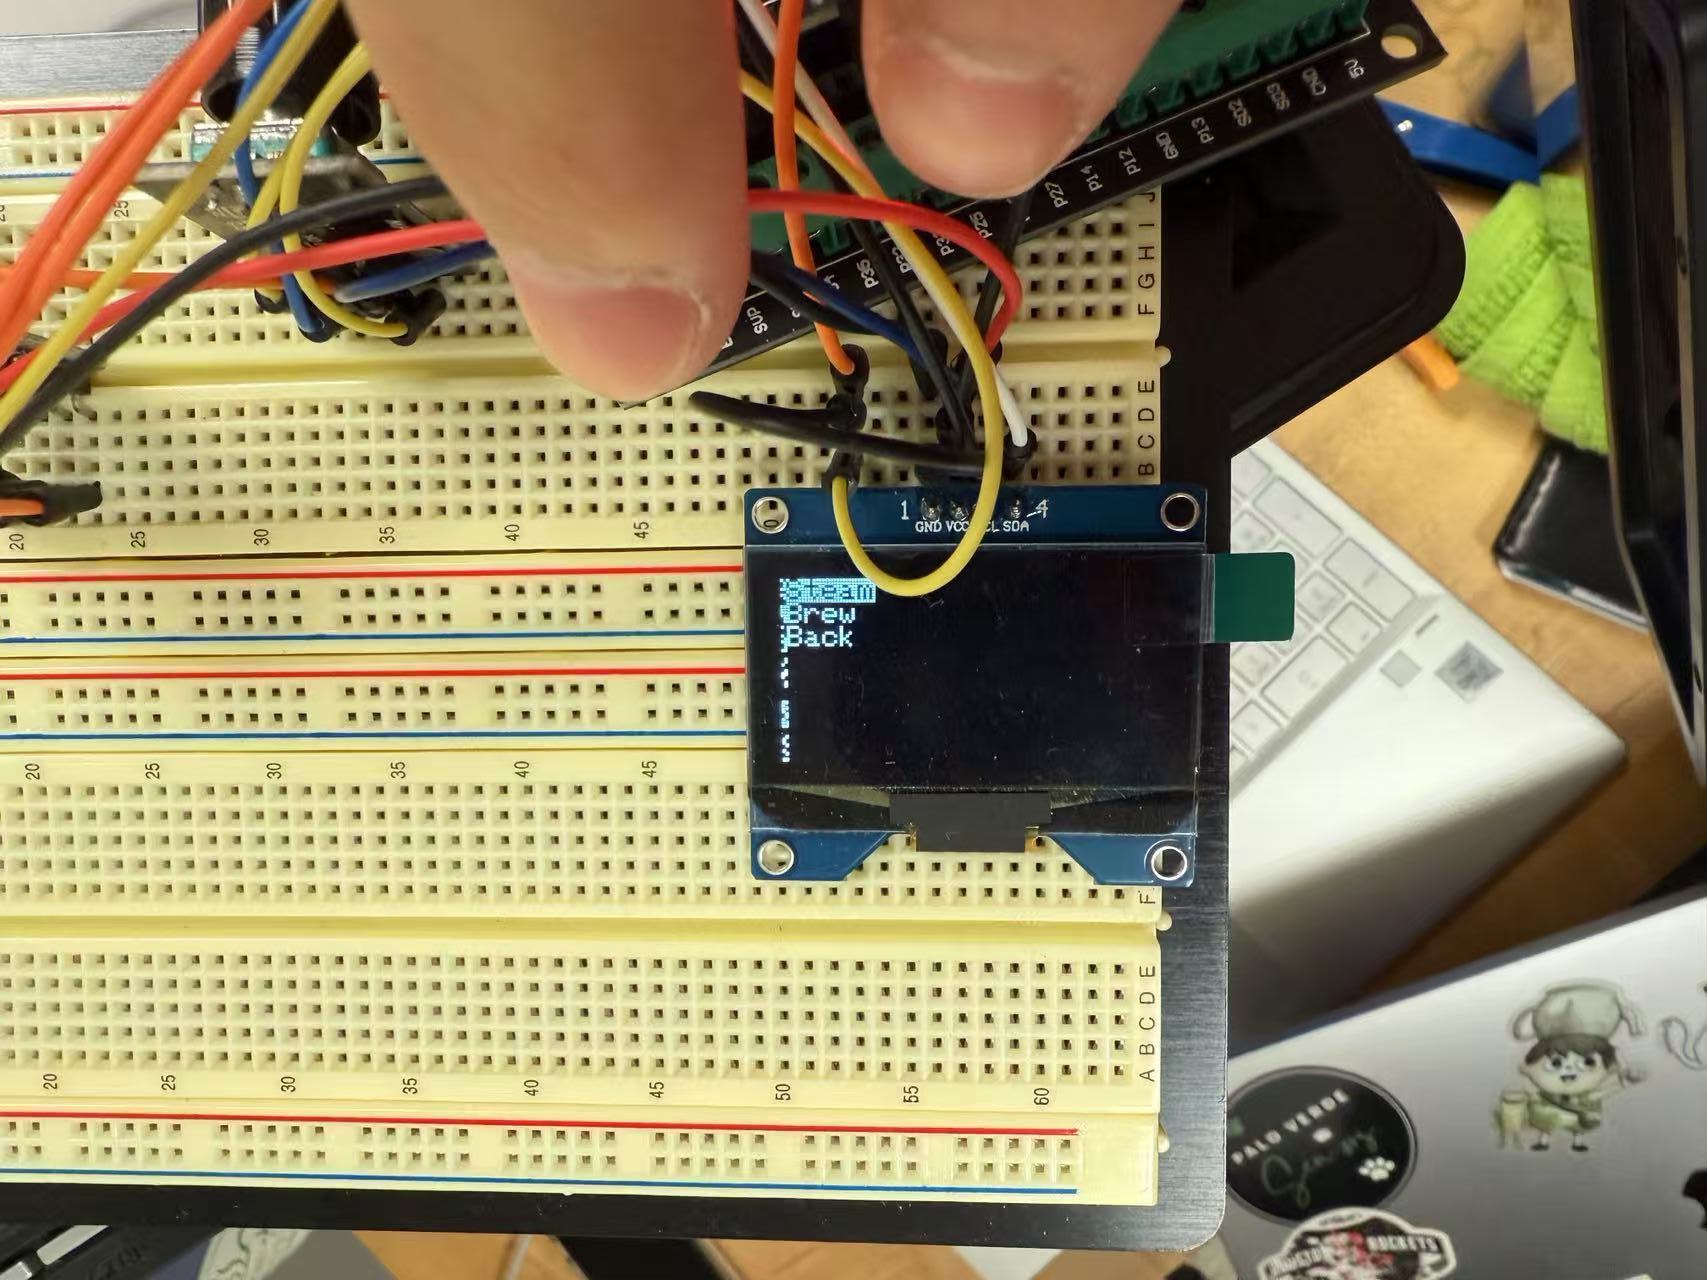
Rotary encoder + push button navigation, target setpoints, brew animation, and countdown.
Zero-cross triac control (PSM) and clamped PID outputs; debounced interrupts for stability.
Two-function API (init(), update()) renders real-time charts on GitHub Pages.
Pluggable pins via pins.h; future Wi-Fi dashboard, data logging, and profiling.
The pressure loop reads the transducer, applies averaging to reduce noise, converts to psi, and feeds the PID controller. The PID output (0–100%) is mapped to PSM levels (0–127) to modulate AC power via zero-cross detection.
// Minimal usage example
pressureCtl.setSetpoint(9.0);            // target = 9 bar
pressureCtl.setCurrentPressure(psiReading);
pressureCtl.update();                     // runs PID and updates PSM
Tip: keep the ISR tiny (zero-cross flag only) and compute in the main loop for stability.
The temperature loop reads MAX6675, drives ESP32 MCPWM to control heater duty cycle, and maintains a stable brew temperature.
// Minimal usage example
tempControl::setSetpoint(93.0); // 93 °C
tempControl::setCurrentTemp(currentC);
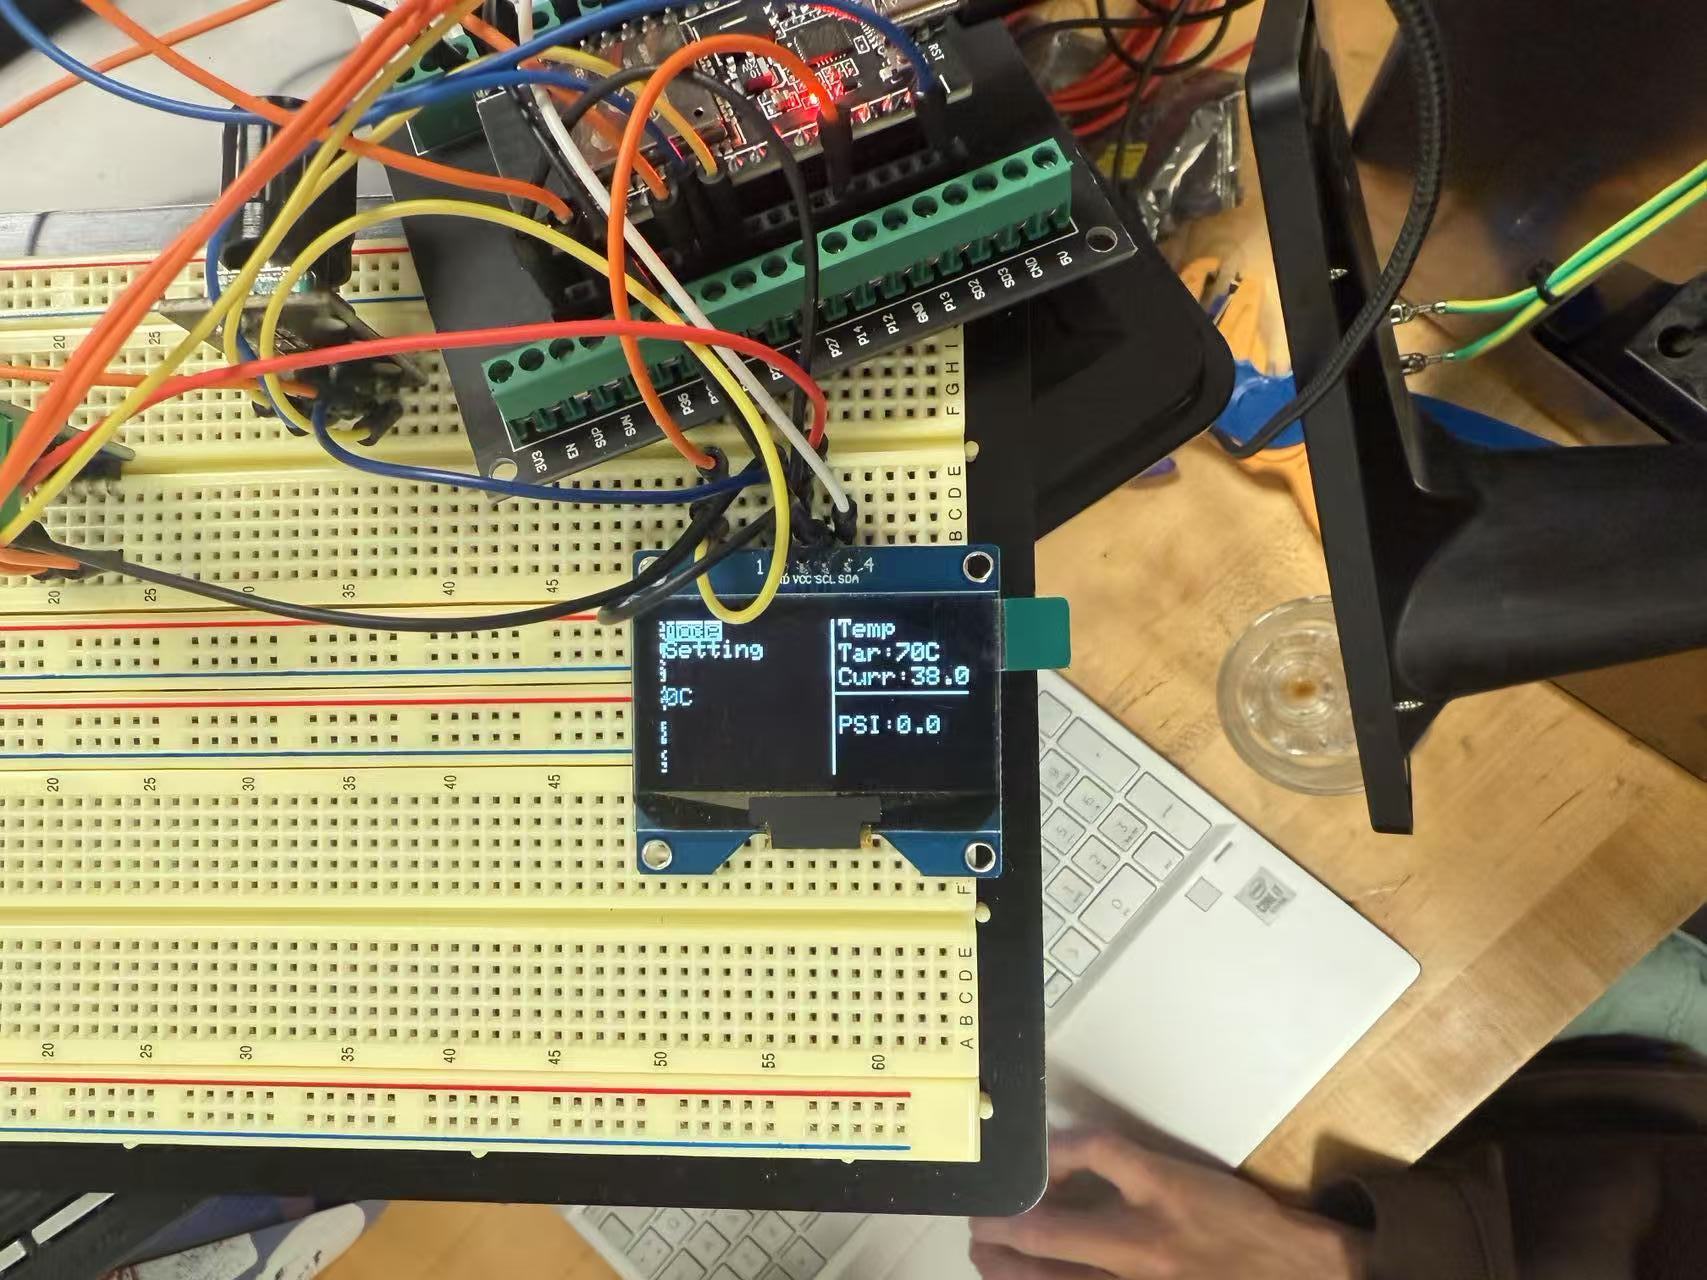
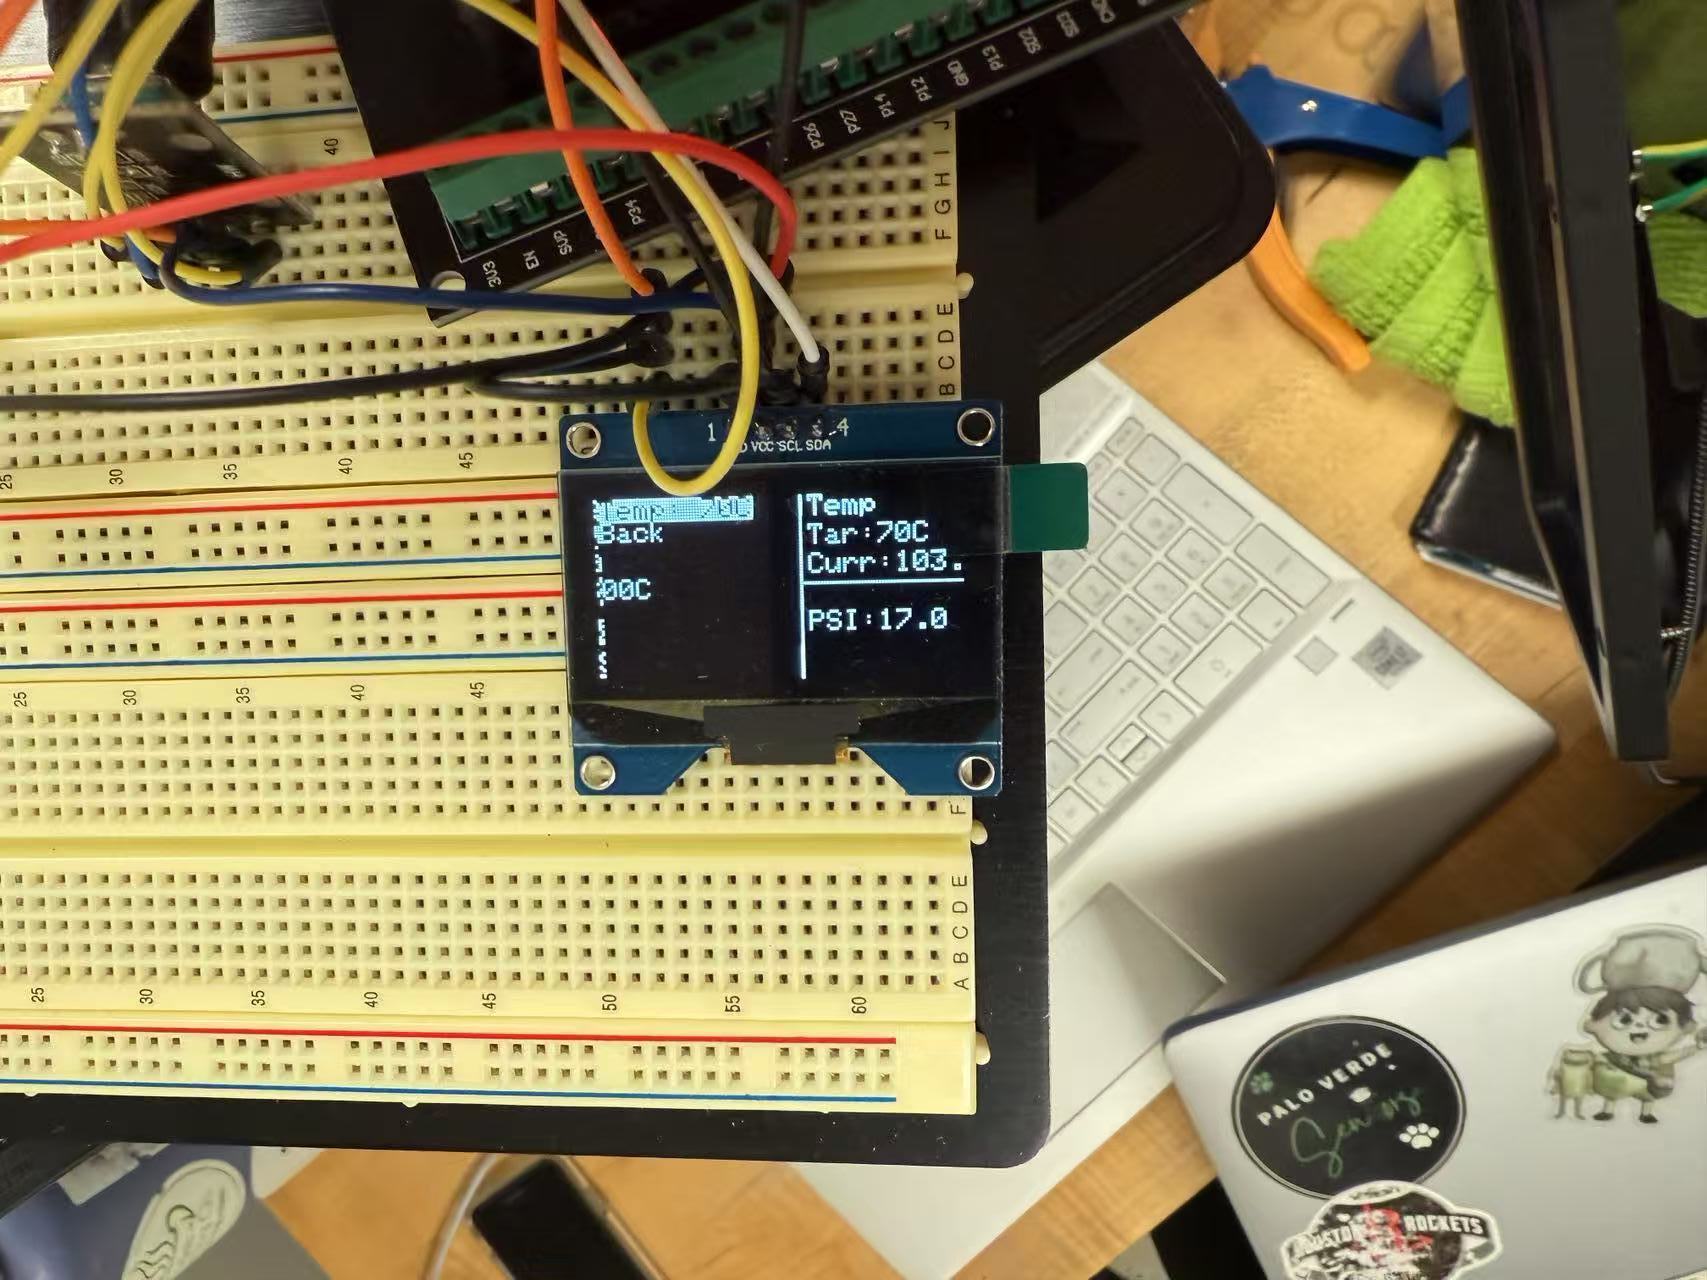
tempControl::update(); // PID compute + MCPWM duty updateThe OLED (Adafruit SH1106) shows live pressure/temperature, setpoints, and a brewing animation. A rotary encoder provides intuitive navigation; short press to select, rotate to adjust.
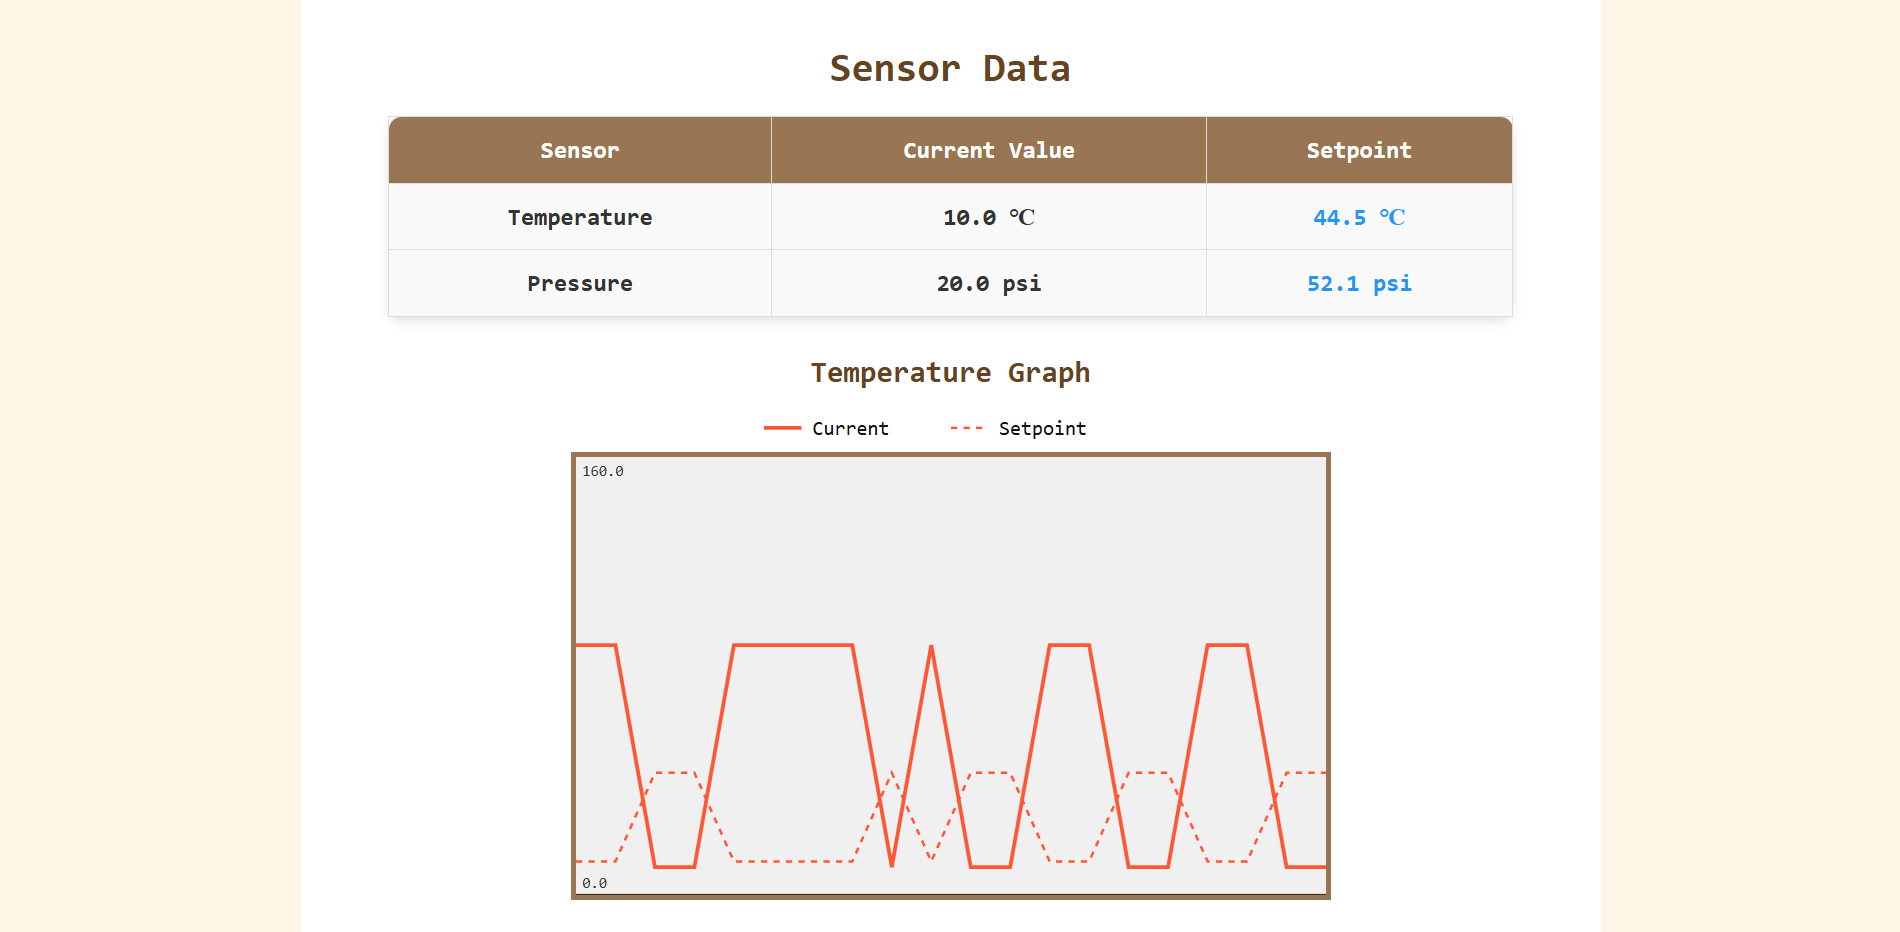
For the capstone demo, we provide a lightweight browser dashboard
(GitHub Pages) to visualize telemetry in real time. The page exposes exactly two
global functions for the firmware or a small host script to call:
init() and
update(tempC, psi, tempSetpointC, psiSetpoint).
No extra dependencies or build steps.
init() — call once on start (e.g., in setup()).update(tempC, psi, tempSetpointC, psiSetpoint) — call periodically (e.g., every 100–250 ms).Units: tempC/tempSetpointC in °C, psi/psiSetpoint in psi.
// Pseudocode (firmware/host bridge)
  void setup() {
    // ...
    dashboard.init();          // maps to page's init()
  }

  void loop() {
    // read sensors + setpoints ...
    dashboard.update(tempC, psi, targetC, targetPsi);
    delay(150);                // update rate for smooth charting
  }
Styling (colors, layout, images) is easily customizable if we want a different look for the poster/demo.